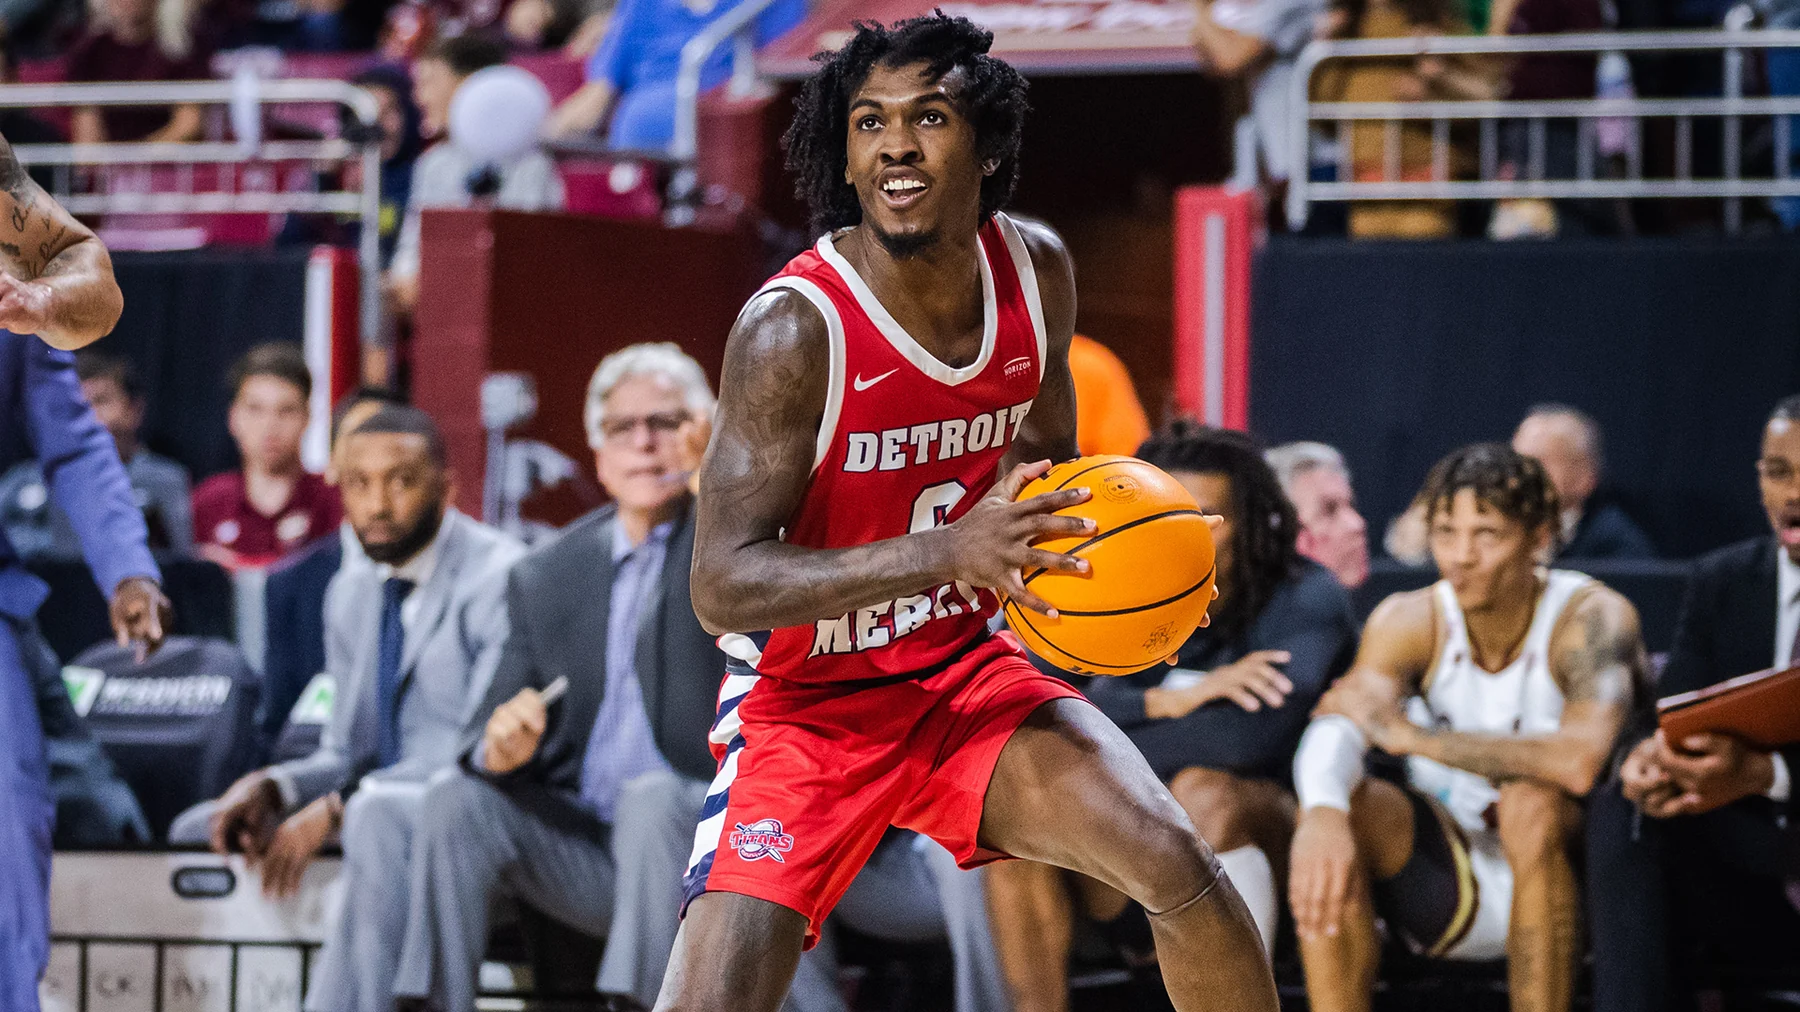
Who leads NCAA Division I basketball in career made threes?
Antoine Davis leads NCAA Division I men’s basketball with 588 career made threes; Caitlin Clark leads the women’s category with 548. The figures are made three-point field goals, not total career points or shooting percentages. They were checked on October 14, 2026 against the NCAA’s currently linked men’s and women’s record books.
Keep Division I in the description. NCAA Division II and III have their own record tables, and other college associations maintain separate statistics. A list focused on the most familiar Division I players should not silently become an all-college leaderboard. The correct comparison starts with the division and statistic you actually want.
Career makes answer a cumulative-production question: how many shots beyond the arc went in during the counted career? Percentage asks how often those attempts went in. Makes per game adds the number of games. Those measures can produce different leaders without any contradiction, because each rewards a different combination of accuracy, volume and opportunity.
The distinction also prevents a scoring error. Multiplying made threes by three gives points contributed by those baskets, not the player’s complete scoring total. Two-point baskets and free throws belong to the wider career-points calculation. A prolific three-point scorer can lead both categories, but one table does not establish the other.
The men’s record book and women’s record book separate these measures. Read the heading and minimum qualification requirements before comparing entries. A percentage record usually needs an attempt or made-shot threshold so that a tiny sample does not become the apparent leader.
For a fan, the career leaderboard is best used as a map of sustained shooting production. It identifies players whose offenses repeatedly found or created three-point opportunities. It does not tell you whether every shot was open, whether the player created it off the dribble or how a defense guarded the possession.
The tables below keep men’s and women’s basketball separate, then explain how to interpret them. Career rank is the starting evidence. A judgment about the best shooter needs the rate, role, sample and era alongside the total.
The men’s career three-point leaderboard
The leading five players in the checked NCAA Division I career-makes table are listed below. Ending season follows the record book’s season-ending-year convention. Multiple schools identify a combined college career, rather than a claim that every make happened at the final institution.
| Rank | Player | School or schools | Career made threes | Ending season |
|---|---|---|---|---|
| 1 | Antoine Davis | Detroit Mercy | 588 | 2023 |
| 2 | Darius McGhee | Liberty | 528 | 2023 |
| 3 | Max Abmas | Oral Roberts / Texas | 512 | 2024 |
| 4 | Fletcher Magee | Wofford | 509 | 2019 |
| 5 | Travis Bader | Oakland | 504 | 2014 |
What Antoine Davis’ total measures
Davis’ 588 is confirmed by Detroit Mercy’s official career profile. The NCAA book gives 1,566 attempts. Dividing makes by attempts produces approximately 37.5%. That percentage explains a rate; the record total explains the accumulated number of successful shots.
A high-volume career involves repeated opportunities over time. A scorer must remain in the rotation and keep receiving or creating attempts. The cumulative table captures that sustained production. It does not isolate accuracy from workload, and it should not be rewritten as a list of the players with the highest shooting percentage.
Magee supplies useful historical context. Wofford’s 2019 tournament report describes seven made threes in an 84-68 win over Seton Hall that took him to 509 and the record at that time. The current table places him fourth because later careers moved above his total. The old report is accurate history when its date remains attached.
For a viewer, that moment also connects a career statistic to a game’s practical value. Seven makes contribute 21 points from behind the arc, but their importance also depends on when and how the offense produces them. The recap identifies the result and total; a possession-level explanation needs the game account or film rather than the career column alone.
Abmas’ row illustrates another reading habit. The school column names Oral Roberts and Texas because the total spans his college career. A transfer does not reset a national career accumulator. Conversely, a school’s own record book may count only what happened at that institution, so a national total and a school total can differ.
Use the list to identify sustained shooting careers, then investigate the question you care about: accuracy, creation responsibility, postseason production or team context. The site’s men’s career points guide covers the broader scoring comparison. A three-point table should remain focused on the shots it actually measures.
The women’s career three-point leaderboard
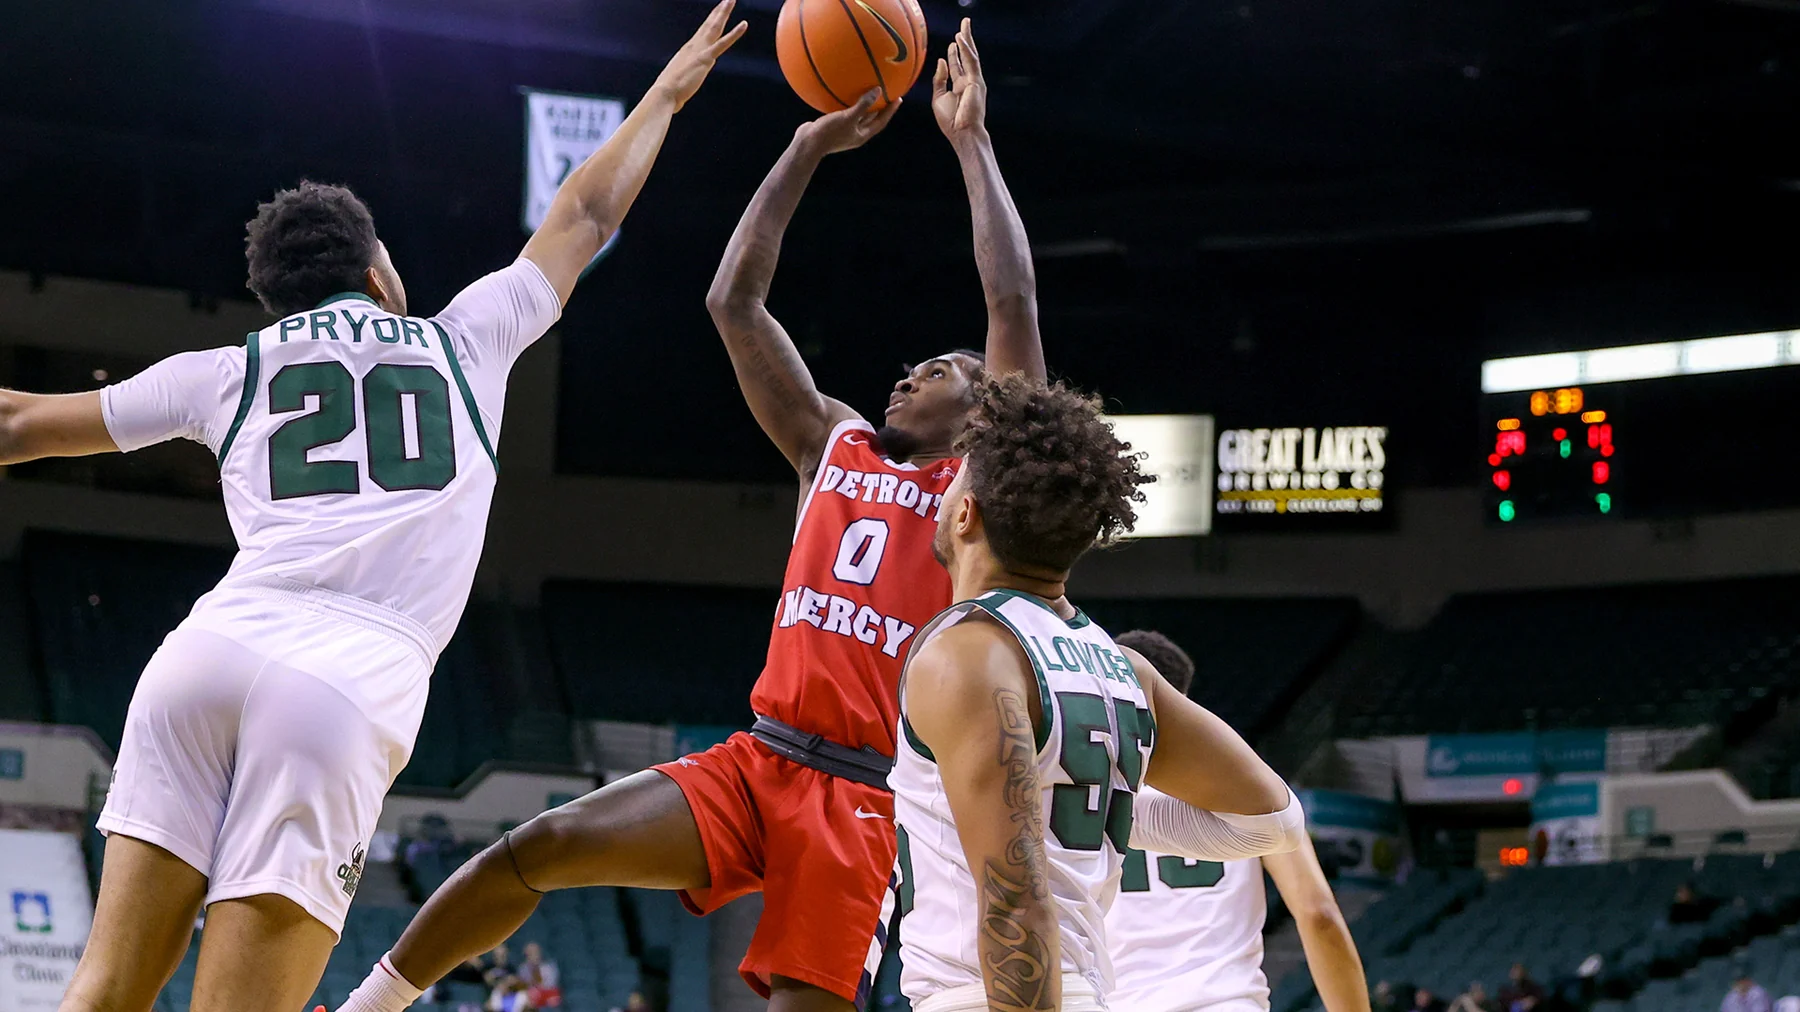
The checked Division I women’s table is headed by Clark, followed by Taylor Robertson and Kelsey Mitchell. Taylor Pierce and Jess Kovatch share the next position at 472. This is a ranking of individual players; a partial-career entry for a player should not be counted again as though it were a different person.
| Rank | Player | School | Career made threes | Ending season |
|---|---|---|---|---|
| 1 | Caitlin Clark | Iowa | 548 | 2024 |
| 2 | Taylor Robertson | Oklahoma | 537 | 2023 |
| 3 | Kelsey Mitchell | Ohio State | 497 | 2018 |
| =4 | Taylor Pierce | Idaho | 472 | 2019 |
| =4 | Jess Kovatch | Saint Francis (PA) | 472 | 2019 |
Clark’s career ended with 548 makes in 139 games, from 1,452 attempts. The NCAA figures imply approximately 37.7% from three and 3.94 makes per game. Those calculations describe the same career from different perspectives: conversion rate and production per appearance, rather than the cumulative total alone.
Robertson finished Oklahoma with 537, as the school’s March 2023 career-ending announcement confirms. It described the record she held at that time. Clark later moved above her, so Robertson’s historical record-breaking moment and her present position should be described with their dates.
Do not add professional statistics to a college total. Clark and Mitchell continued their basketball careers beyond college, but this leaderboard measures the NCAA career category. A search result mixing WNBA and college figures can create an apparently different answer simply because it has changed competitions.
The tie at 472 also deserves its proper treatment. Pierce and Kovatch have equal made-three totals in this category; placing one arbitrarily ahead of the other would imply a difference the table does not establish. A separate comparison of attempts, games or percentages could distinguish their profiles, but it would answer a different question.
For game analysis, use the list as evidence of repeated shooting production, then inspect the player’s responsibilities. A guard creating shots with the ball and a shooter receiving passes after off-ball movement can put pressure on a defense in different ways. The cumulative total does not tell you the share of attempts created by each method.
It also does not establish that a player with fewer total makes was less threatening in an individual matchup. Opponents respond to current form, available personnel and the shots a team’s actions can produce. Career totals provide historical scale; a scouting question needs the specific season and game.
The site’s women’s career scoring guide places these players in the wider points discussion. Keep the made-three statistic visible when using this table, and check the latest official record edition before describing a future player’s position.
Career makes, percentage and season records answer different questions
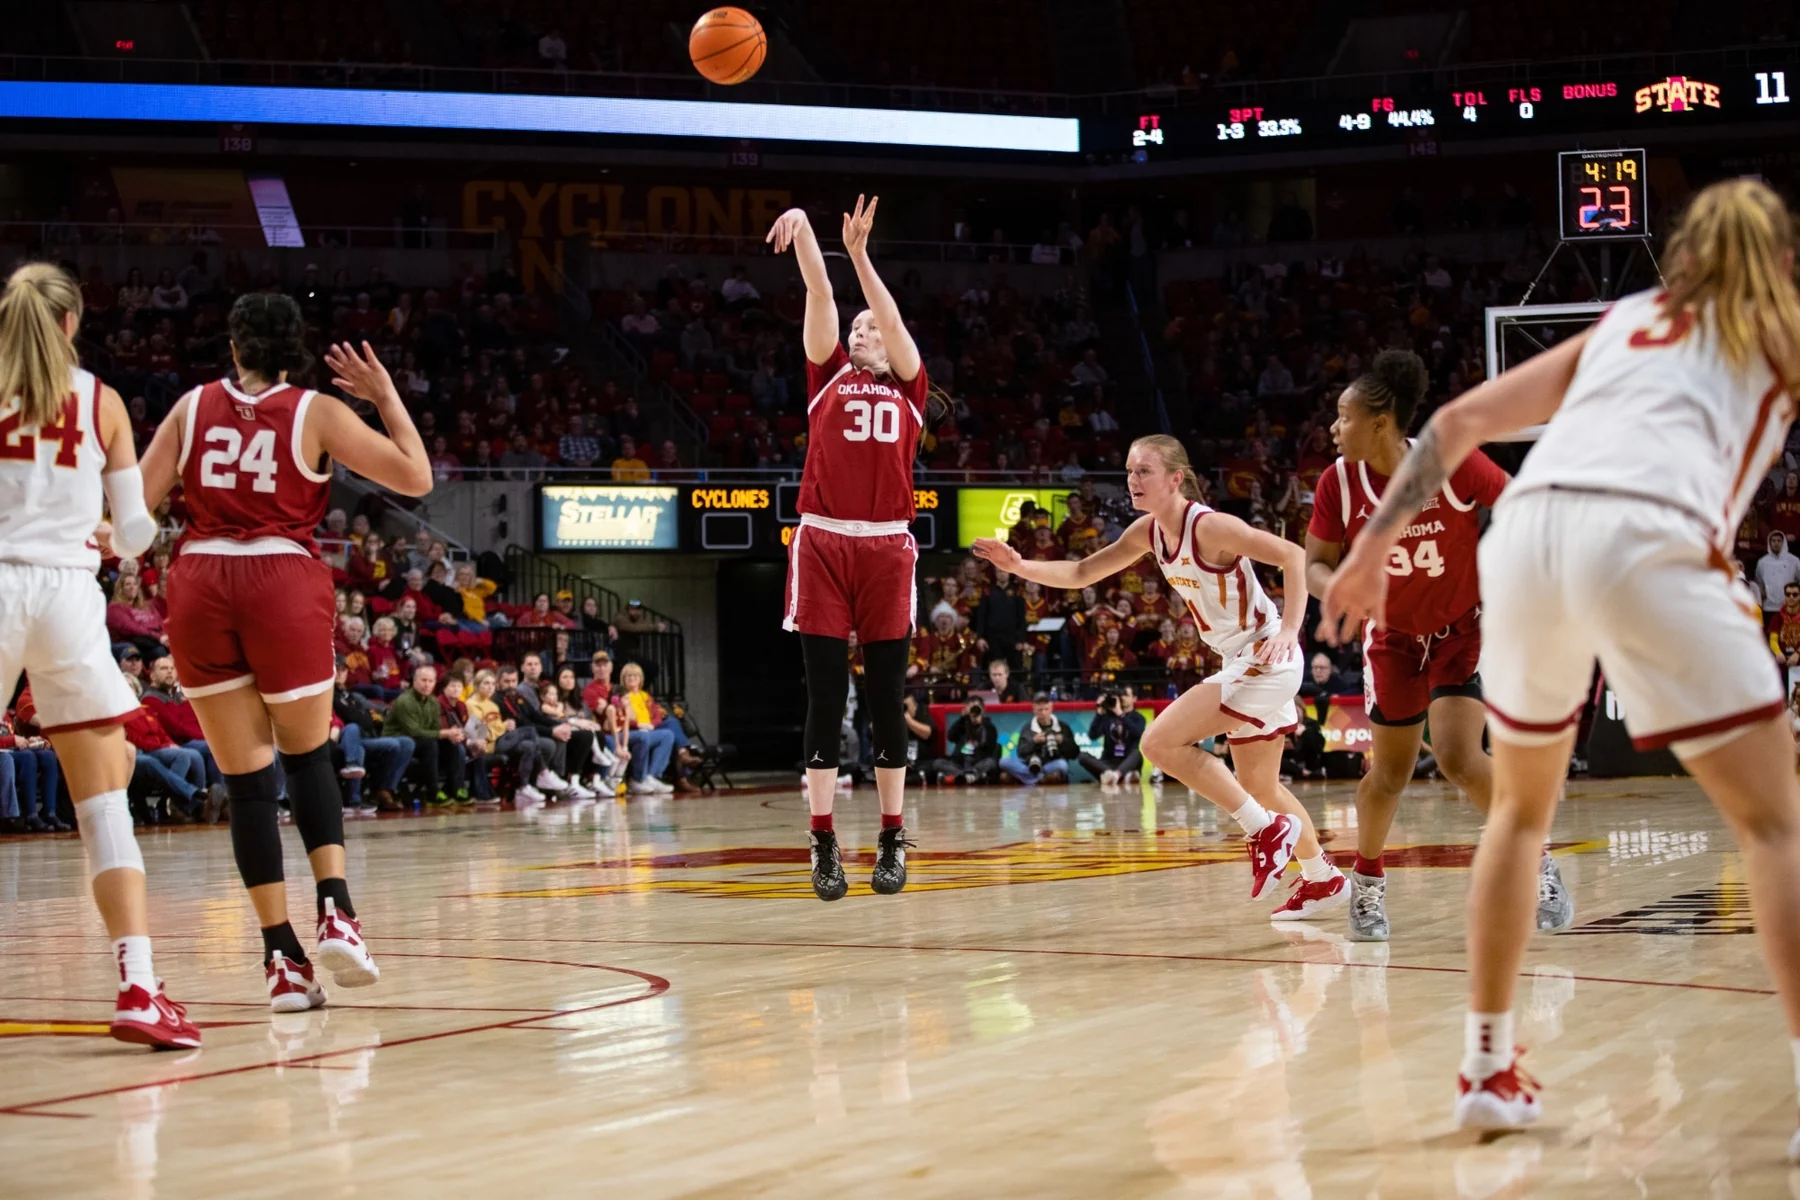
A search for the best college three-point shooter can produce several correct answers because the underlying question changes. Career makes reward accumulated production. Percentage describes how often attempts went in. Makes per game describe production across appearances. A season record isolates one campaign. Decide which of those measures you want before choosing a leaderboard.
Volume versus accuracy
The women's Division I career percentage record provides a useful contrast. The NCAA record book lists Notre Dame's Alicia Ratay at 47.6 percent, with 262 makes on 550 attempts from 2000 through 2003. That category requires at least 150 made threes. Ratay's total is below the career-makes leaders above, but her qualifying accuracy is the record in this separate category.
Compare the denominators as well as the percentages. Clark's 548 makes came on 1,452 attempts; Robertson's 537 came on 1,221. Clark finished with more makes, while Robertson converted a higher proportion of her attempts. Both statements can hold at once. Neither calculation, by itself, explains shot difficulty, defensive attention or the circumstances in which a player received the ball.
For a viewer, this distinction changes what to watch. A shooter taking a contested attempt late in the shot clock faces a different problem from a teammate catching an open pass after a defensive rotation. The career table does not label those possessions. Treat percentage as a starting point for watching a player's decisions, rather than a complete explanation of how the offense worked.
A single season is a separate competition
Clark's 2024 Iowa season ended with 201 made threes on 532 attempts across 39 games. The men's Division I single-season record is a tie at 162: Stephen Curry reached it for Davidson in 2008, and Darius McGhee matched it for Liberty in 2023. The men's NCAA book lists 369 attempts for Curry and 411 for McGhee in those seasons. A description that calls Curry the sole men's record holder misses that tie.
A season total and a career total therefore need separate labels even when the same players appear in both conversations. One extraordinary year does not automatically move a player above someone who accumulated more threes over several years. Likewise, a single game's scoring explosion is its own category; our single-game scoring records guide separates that question from sustained production.
When comparing a current player with these records, write down makes, attempts and games from the same statistical endpoint. Mixing a midseason total with a completed career, or regular-season games with a season including postseason play, changes the comparison before any basketball interpretation begins.
How the three-point line and career length change comparisons
A career leaderboard is an accurate ledger, but it is not a controlled shooting experiment. Players competed in different seasons, under different court dimensions and across different numbers of appearances. Those conditions help explain what a total represents without changing the actual number of baskets credited to anyone.
Different arcs and different opportunities
The men's Division I three-point line moved to the international distance for 2019–20. Tennessee's official basketball records history documents that change. The women's line followed for 2021–22, as confirmed by the NCAA's approved rules changes. The distance is 22 feet, 1¾ inches around the main arc, with shorter 21-foot, 7⅞-inch corners. Calling every three-point attempt a shot from exactly the same distance would be inaccurate even within a modern game.
Davis' 2018–23 career crossed the men's change, and Robertson's 2018–23 career crossed the women's change. Clark's 2021–24 record-book seasons likewise include competition on either side of the women's move. Their official totals remain valid, but they do not all describe careers played entirely behind one identical arc. The statistic does not attach a distance adjustment to each basket.
Games played offer another concrete comparison. Davis' 588 makes came in 144 appearances; Clark's 548 came in 139; Robertson's 537 came in 151. Robertson had the most appearances of those three, while Davis had the most makes. That combination is a reminder that opportunity matters without being a complete explanation. Shot frequency and conversion also affect the final tally.
Season labels are less informative than appearances on their own. A short schedule, injury or long postseason run can change opportunities within a single year. Davis' final season illustrates the value of keeping both units: Detroit Mercy's April 2023 career-ending report records 159 made threes and a national-leading 4.82 per game that year. A season can be exceptional in its average while falling below the single-season total record.
There is no reliable shortcut that converts all of those careers into a single supposedly neutral ranking. Adjusting totals to four years ignores appearances within those years; dividing by games removes accumulated longevity from the question. Show the original totals first, then use the relevant denominator to answer a narrower question. That approach preserves the achievement and makes the comparison more useful.
Use the leaderboard to understand shooting roles
The most useful way to watch a career three-point leader is to follow the possession before the shot. Notice where the player receives the ball, how quickly the feet are set and whether a dribble is required to create space. A total records the successful endpoint. The possession shows how the team arrived there.
Fletcher Magee provides a concrete historical game to revisit. He made seven threes and scored 24 points against Seton Hall in Wofford's first NCAA Tournament victory in 2019. The school's Hall of Fame profile preserves that milestone and his eventual 509 career threes. Those baskets carried immediate competitive value in a tournament win, as well as moving a number in a career table. His record at graduation and his current fourth-place position are both part of the story.
Watch the teammate actions too. A screen can change the route a defender must take. A pass delivered at shooting height can let the receiver release without reorganizing the body. A drive can force a helper to leave an outside player. These are useful things to look for on film; a box score cannot tell you how often each happened across an entire career.
Clark offers a different viewing question because Iowa's archived roster identifies her as a point guard. Follow the choice between shooting and passing when a second defender approaches. Her 548 career threes establish sustained outside production, but the tally does not show the possessions in which defensive attention created an opportunity for a teammate. Watching those decisions adds information that cannot be extracted from the leaderboard alone.
For a player in a current game, compare the season line with the career line before announcing a chase. The relevant gap is record total minus current total, with both numbers covering the same category. A pace calculation may help explain the scale of the task, but it cannot promise future appearances, minutes or successful shots. Postseason qualification is uncertain until the games are actually earned.
Keep a short statistical note beside the game: made threes, attempts and appearances, followed by the date of the update. Then watch whether the offense repeatedly generates the same kind of opportunity. Use the college basketball schedule to find the next matchup, and let the live game answer the tactical questions. The record book supplies the achievement; the possessions reveal the basketball behind it.
Sign in with Google to join the discussion.