
Where to find the official women’s WAB rankings
Find the official women’s college basketball Wins Above Bubble rankings on the NCAA’s Division I women’s basketball rankings page. Open the WAB table, look for your school, and read the date above the rows before comparing teams. The table gives you two different numbers. Rank is the team’s place in the list, and WAB is the estimate of how many wins the team has gained or lost relative to what a tournament bubble team would be expected to earn against the same schedule. NCAA women’s WAB rankings
A WAB value of zero means a team has won as often as the benchmark would be expected to win, even if the team’s record looks strong or weak at a glance. A positive value means the team has exceeded that expectation. A negative value means it has fallen short. For a quick comparison, the rank tells you who sits higher, and the value tells you whether the two teams are separated by a sliver or a substantial gap in estimated wins.
The NCAA’s women’s tournament selection page also links to the public team sheets. If the sheets load, use them when your question goes beyond who ranks higher. They put team records and opponents in the same place, so it is easier to see where a difference in the rankings comes from. If the sheets are unavailable, the WAB table still gives you the rank and value you need, while a team’s game log gives you the results and locations. NCAA women’s selection resources
Check the season and the update date
When checked on November 21, 2026, the official public WAB table still displayed games through April 5, 2026. That date belongs to the completed 2025–26 season. Look for a newer date before citing the table as evidence about 2026–27. The NCAA says it first releases NET rankings in December and updates them daily after that. Since WAB uses opponent NET, early-season results are worth following while you wait for a table dated to the new season. Use the women’s college basketball schedule to check which games have already been played. NCAA explanation of the team sheet
How Wins Above Bubble turns a schedule into a number
Imagine sending the same benchmark team through every school’s schedule. It would likely beat some opponents and struggle against others, especially away from home. The NCAA estimates what that benchmark would win, then subtracts the estimate from the actual team’s win total. That puts a 20-win team with a demanding schedule and a 24-win team with an easier one on a comparable scale. Both are being measured against the same standard of opponent and venue difficulty. NCAA’s women’s WAB infographic
Work through the expected-wins calculation
Take an imaginary three-game stretch in which a benchmark team has a 40 percent chance of winning the first game, 70 percent in the second and 90 percent in the third. Add those probabilities and its expected wins come to 2.00. If the real team sweeps the stretch, its contribution to WAB is three minus two, or +1.00. If it wins twice, it matches the benchmark. If it wins only once, it finishes one win below the benchmark at −1.00. The percentages here are for illustration. The NCAA’s own example uses the same subtraction over a full schedule. NCAA selection criteria and WAB example
Why a road win can carry more weight
Now hold the opponent fixed and change the venue. If the benchmark would win 25 percent of the time on the road and 55 percent at home, a road win would earn 0.75 above expectation. Winning at home would earn 0.45. The same example helps explain the other side. A loss in a difficult road game would cost 0.25, while a loss at home would cost 0.55. The venue changes what the benchmark was expected to do. A neutral game typically sits between the two.
Keep the opponent’s NET assessment fixed when thinking through a single result. A one-point win and a 20-point win contribute the same actual win to this WAB calculation. The margin can still reveal differences in how efficiently a team played. NET tracks that dimension and feeds its assessment of the opponent into WAB. The guide to NCAA women’s NET rankings and quadrants explains what a NET team sheet measures. NCAA women’s NET and WAB FAQ
What a dated 2025–26 résumé shows
The final NCAA tables for April 5, 2026 show how much the order can change when you switch from NET to WAB. UConn finished 38–1 and led NET. UCLA finished 37–1 and ranked second in NET, yet led WAB by a clear margin. In that snapshot, the Bruins had 22 wins against Quadrant 1 opponents, double UConn’s 11. Both had one Quadrant 1 loss. The tables tell you how often the teams won and add context about the difficulty of the games they played. Official women’s NET rankings
| Team | Record | NET rank | WAB rank | WAB |
|---|---|---|---|---|
| UCLA | 37–1 | 2 | 1 | +21.48 |
| South Carolina | 36–4 | 3 | 2 | +17.95 |
| Texas | 35–4 | 4 | 3 | +17.32 |
| UConn | 38–1 | 1 | 4 | +13.28 |
Within this snapshot, UCLA’s WAB was 8.20 higher than UConn’s. Each total compares that school with an expected win total for its own schedule. The 8.20 gap describes those two schedule-adjusted results, so it has no direct use as a scoring margin or a prediction for a head-to-head game. Also notice that both teams sit comfortably above zero. A résumé can be excellent even when a team that played a very different schedule ranked ahead of it. Official women’s WAB rankings
Read one result in its schedule context
On April 5, UCLA beat South Carolina 79–51 in the national championship game in Phoenix. In those final rankings South Carolina placed third in NET, so the win gives you a concrete example of a result against a highly rated opponent on a neutral court. The 28-point margin helps explain how the game went. The WAB model records a win and compares it with the benchmark team’s expected return against that opponent at that location. A single end-of-season WAB number cannot tell you the exact contribution of the title game. UCLA’s national title recap
Two days earlier UCLA had beaten Texas 51–44 in the national semifinal. Texas also dealt UCLA its only loss in November. Both games help explain the Bruins’ season because WAB goes through the whole schedule. The November loss remains part of the résumé beside the April win. And because the April 5 tables include the tournament itself, use them to understand last season’s results. For a March bracket argument, compare rankings from before the selection announcement instead. UCLA’s national semifinal recap

Why the women’s bubble benchmark changed for 2027
The NCAA changed which team represents the women’s tournament bubble as the 2027 field grows from 68 to 76 teams. For the 2025–26 season, the reference was a team ranked No. 45 in women’s NET. For the 2027 championship, the Division I Women’s Basketball Committee moved that reference to No. 55. If you see both numbers in NCAA material, match each one to its season. The committee announced the revised benchmark on July 10, 2026. NCAA committee update on the WAB benchmark
The reference team sets the expected win total in the calculation. Change the reference, and the number of wins it would be expected to earn against a particular set of opponents can change too. This matters when you compare a WAB value from the 68-team era with a value from the 76-team era. A team at +1.5 in either season is ahead of that season’s benchmark by the same number of wins. To say which team had the stronger résumé, you still need its season, schedule, and opponent context. There is no shortcut that converts one year to the other by adding ten places to WAB.
No. 55 refers to the rank of the team used as the standard in NET. It does not designate NCAA bracket position 55, or a fixed place in a line of teams competing for the final at-large bid. Among the 76 tournament teams, 32 are automatic qualifiers and 44 receive at-large bids. A conference tournament champion can qualify even if its WAB sits well below a team waiting for an at-large bid. That is one reason watching those conference tournaments can change the composition of the field without changing the results on a bubble team’s own schedule. NCAA’s 76-team bracket announcement
When two teams are close in WAB, open their résumés before making a selection call. Look at which teams they beat, where the games were played, and how many chances each team had against strong opponents. The committee reviews additional information, including NET and schedule strength. That fuller record explains why two teams with similar WAB values can draw different outcomes on Selection Sunday. NCAA Division I women’s selection criteria
How WAB affects the 2027 WBIT
The Women’s Basketball Invitation Tournament uses NET and WAB in its own selection rules. It gives eligible teams outside the Division I championship field another postseason opportunity. For 2027, the NCAA is reducing the WBIT from 32 teams to 24 and introducing explicit NET and WAB thresholds. The October 1 announcement lays out which teams qualify automatically and which are guaranteed a look from the selection committee. NCAA announcement of the 2027 WBIT selection rules
What an average rank of 100 actually means
For at-large consideration, a team needs an overall winning percentage of at least .500. Take the school’s numerical place in the NET table and its numerical place in the WAB table, add those ranks together, and divide by two. A team at No. 84 in NET and No. 116 in WAB averages exactly 100. If it meets the record requirement and is eligible, that puts it on the WBIT committee’s consideration list automatically. It still has to be chosen. Use No. 116 from the rank column in that example, since the decimal WAB value measures wins against the benchmark. If the team finishes below .500 overall, the average rank cannot satisfy the record requirement for an at-large bid.
How automatic qualification works
A regular-season conference champion outside the NCAA championship field can qualify automatically with an average NET and WAB rank of 110 or better. For example, NET No. 90 and WAB No. 130 average 110. That pair of ranks meets the automatic qualification threshold for an eligible regular-season conference champion. For a team without a league title, it falls short of the 100 threshold for automatic consideration and carries no automatic bid through this rule.
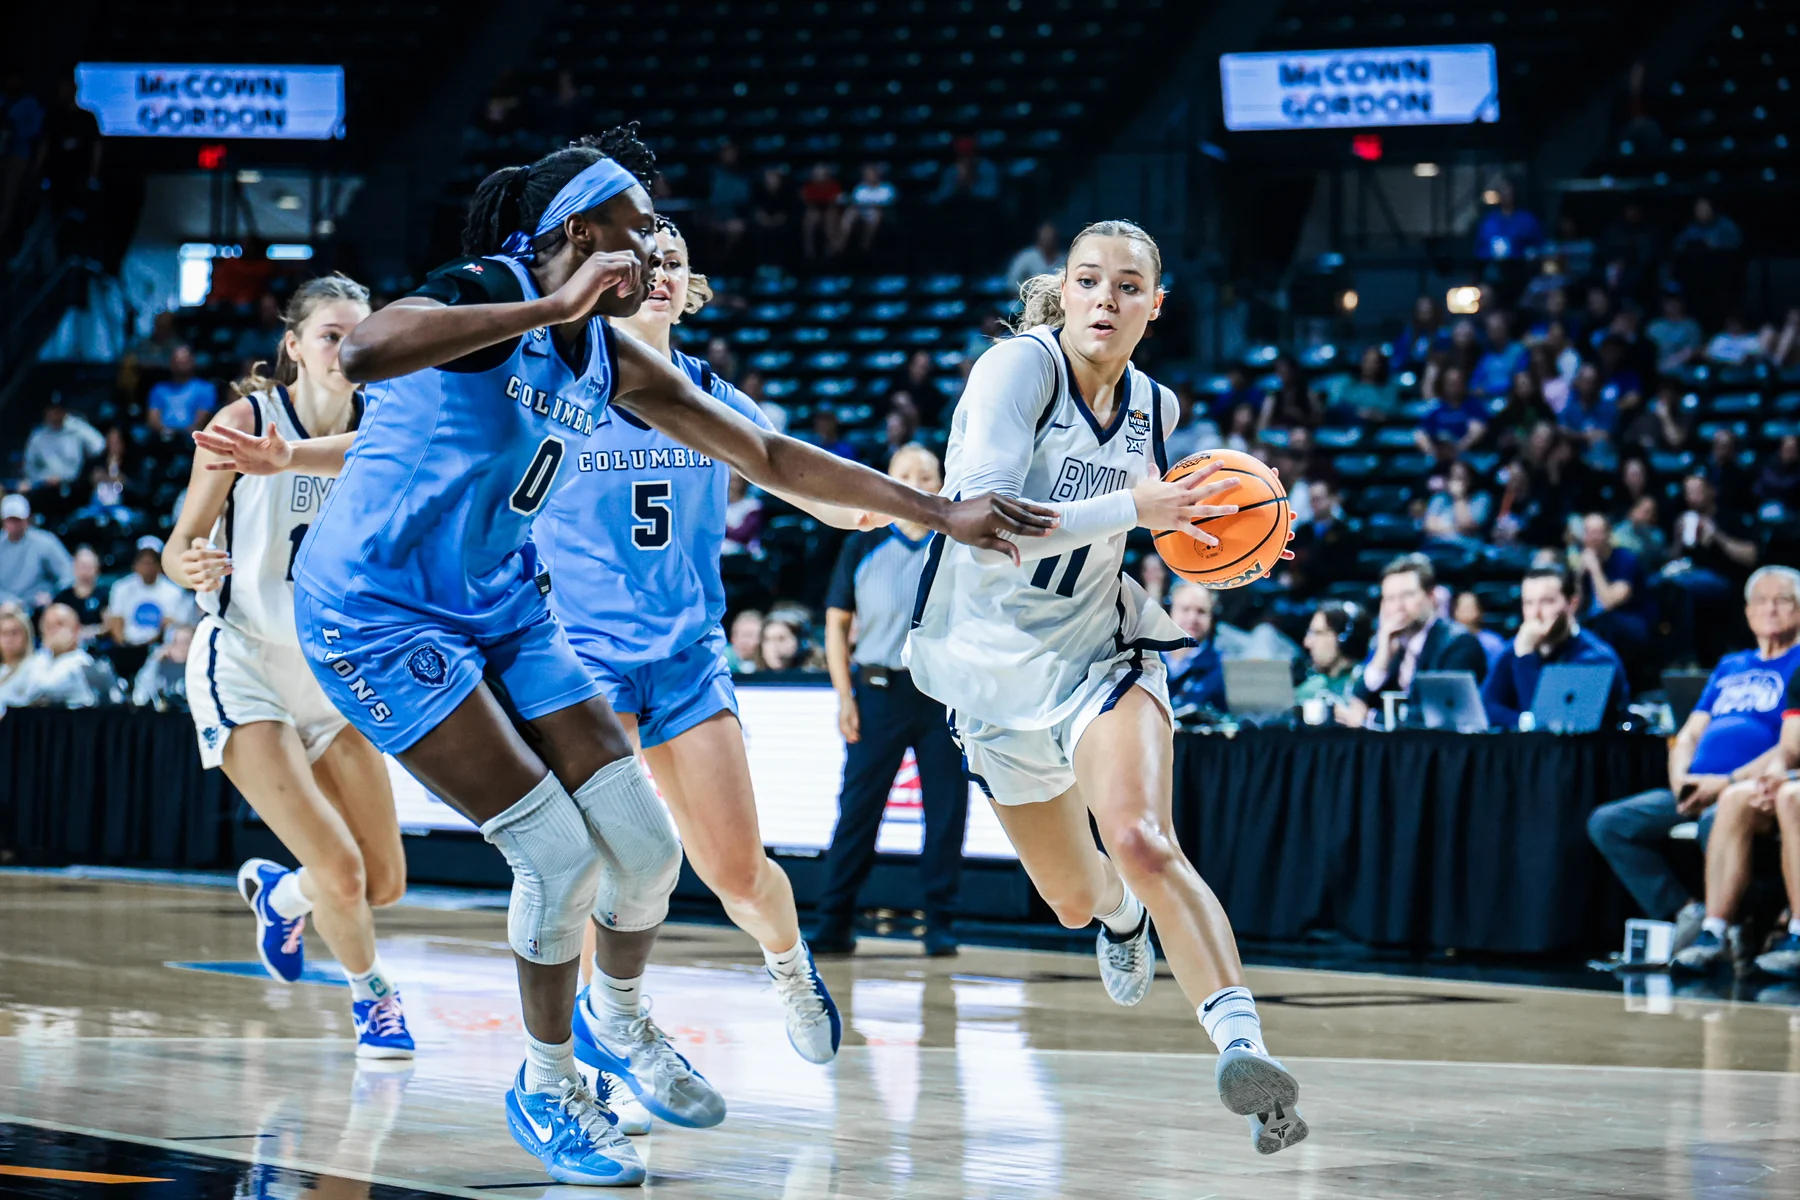
The four teams the Division I Women’s Basketball Committee identifies as the first teams left out of the 76-team tournament also get automatic WBIT bids and become the four No. 1 seeds. The NCAA committee determines that group after evaluating the teams for March Madness. Sorting the WAB list will not reveal who takes those spots. The WBIT selections are scheduled for March 14, 2027. The semifinals and championship are scheduled for March 29 and 31 at Koch Arena in Wichita, the venue where Columbia beat BYU in the 2026 final. NCAA’s 2027 WBIT dates and qualification details
What to check after your team’s next game
Use the women’s college basketball schedule to find the next matchup, then write down the opponent and whether the game is home, away, or neutral. For an early-season event or a postseason game, check the venue alongside any home or away labels you see in the box score. A school can be designated the home team for a game at a neutral site. The location category used in the ranking matters when you compare that result with an ordinary home game.
Save the date, rank, and WAB value before the next game if a current table is available. After the result, wait until the date above the NCAA table covers that game. Find the team again and compare the two values. If the rank falls while the value holds steady to the displayed precision, nearby teams may simply have moved ahead. If the value changes, look at the new result and the latest opponent NET figures together. A prior opponent’s rating can change after it plays someone else, even on a night when your team has no game. Its games remain part of the context for evaluating your team’s schedule. NCAA’s dated WAB table
When friends point to two teams with the same overall record, check a shared opponent and how each team did away from home. Then scan farther down the schedule for the strong opponents one team played that the other did not. It is easy to focus on a single loss, especially in a rivalry game. A broader comparison can show that the team with the more conspicuous loss has also put together several wins in more demanding spots. The committee specifically considers common opponents and multiple kinds of schedule evidence when it compares résumés. NCAA criteria for comparing teams
If a search leads to a women’s RPI table, check the date before using those numbers in a current bracket discussion. The NCAA used the Ratings Percentage Index before adopting NET for women’s basketball in 2020–21. RPI used a combination of a team’s winning percentage and its schedule’s winning percentages. Today’s women’s team sheets use NET and WAB, along with game rows that show the opponents and locations. Start with those rows if you want to explain why a ranking moved, and keep the old RPI tables for comparisons within the seasons they cover. NCAA women’s rankings and team sheet FAQ
Sign in with Google to join the discussion.